Exporting Symantec Endpoint Security Logs to Splunk via API
This guide explains how to use the Event Stream API to export Symantec Endpoint Security (SES) logs into Splunk.
1. Prerequisites
- A Linux host (Ubuntu 20.04/22.04 or similar)
- Docker and Docker Compose installed
- ICDm (SES Cloud) access with Client Application and Event Stream configured
2. Install Docker
Run the following commands on Ubuntu to install Docker:
# Add Docker's official GPG key:
sudo apt-get update
sudo apt-get install ca-certificates curl
sudo install -m 0755 -d /etc/apt/keyrings
sudo curl -fsSL https://download.docker.com/linux/ubuntu/gpg -o /etc/apt/keyrings/docker.asc
sudo chmod a+r /etc/apt/keyrings/docker.asc

# Add the repository to Apt sources:
echo \
  "deb [arch=$(dpkg --print-architecture) signed-by=/etc/apt/keyrings/docker.asc] https://download.docker.com/linux/ubuntu \
  $(. /etc/os-release && echo "${UBUNTU_CODENAME:-$VERSION_CODENAME}") stable" | \
  sudo tee /etc/apt/sources.list.d/docker.list > /dev/null

sudo apt-get update
sudo apt-get install docker-ce docker-ce-cli containerd.io docker-buildx-plugin docker-compose-plugin
Verify installation:
docker --version
3. Deploy Splunk with Docker
docker run -d --name splunk \
  -p 8000:8000 \
  -p 8089:8089 \
  -p 9997:9997 \
  -p 1514:1514 \
  -p 1514:1514/udp \
  -p 8088:8088 \
  -e SPLUNK_GENERAL_TERMS=--accept-sgt-current-at-splunk-com \
  -e SPLUNK_START_ARGS=--accept-license \
  -e SPLUNK_PASSWORD='YourAdminPassword!' \
  -v splunk-etc:/opt/splunk/etc \
  -v splunk-var:/opt/splunk/var \
  splunk/splunk:latest
- 8000 → Splunk Web
- 8088 → HTTP Event Collector (HEC, optional)
- 9997 → Indexer port
- Password is set for the
adminuser
Access Splunk at:https://<host-ip>:8000
4. Install Symantec SOC View Add-on and App
- Download from: SOC View App for Splunk\
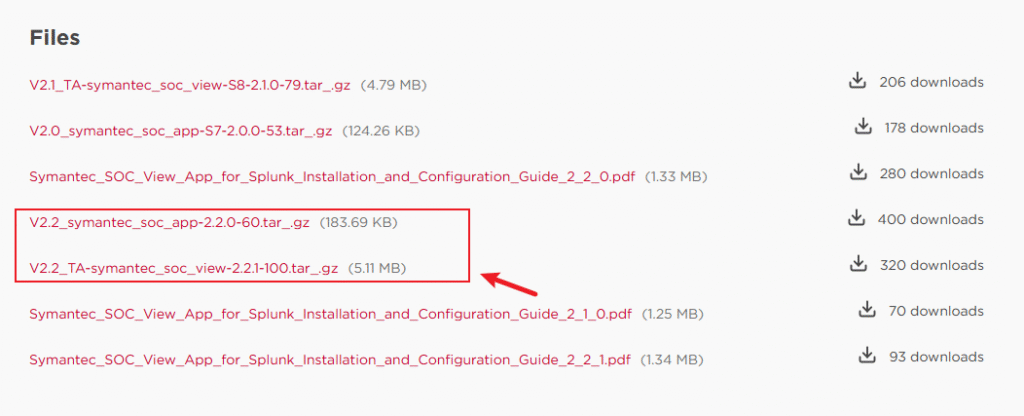
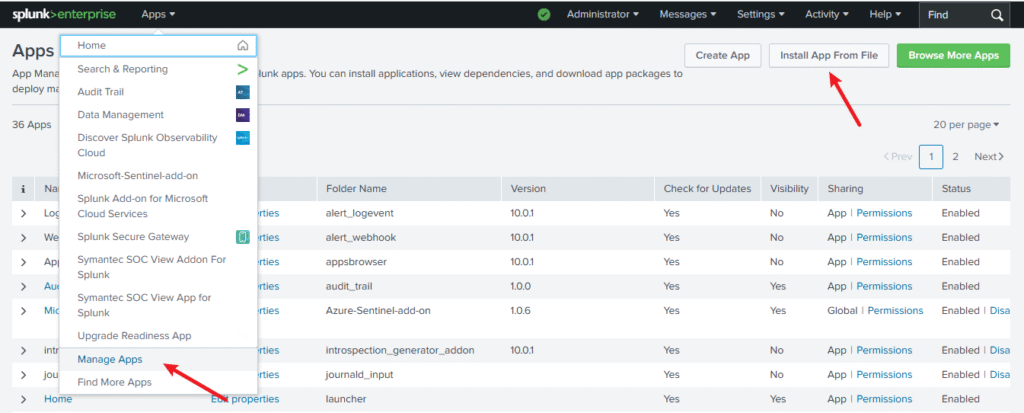
- In Splunk Web: Apps > Manage Apps > Install app from file
- Upload both:
- TA-symantec_soc_view (Add-on for ingestion & field extraction)
- symantec_soc_app (Dashboards & visualizations)
- Restart Splunk.
5. Configure ICDm API in the Add-on
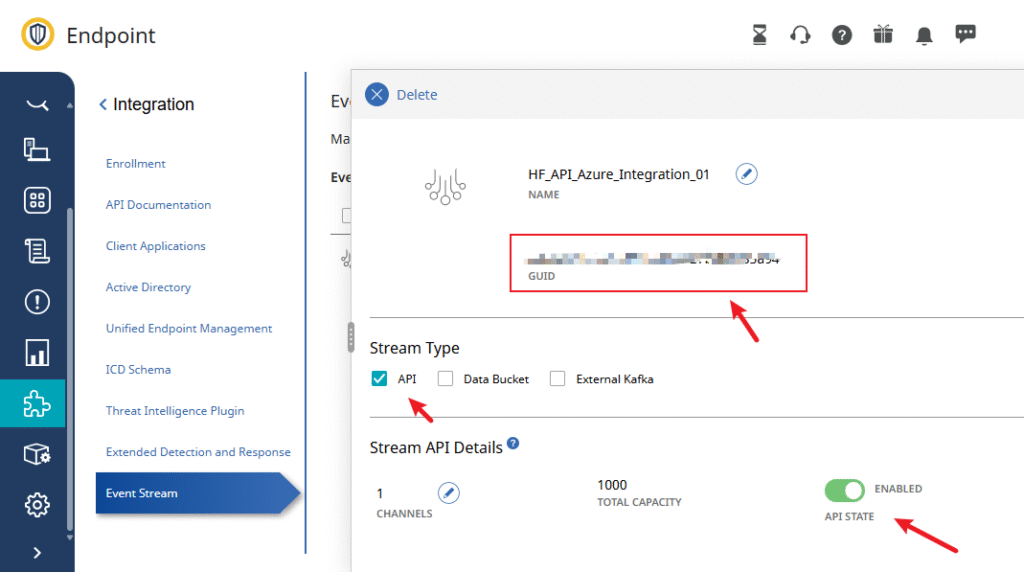
5.1 Create ICDm Client Application
- In SES Cloud console, go to Integration > Client Applications.
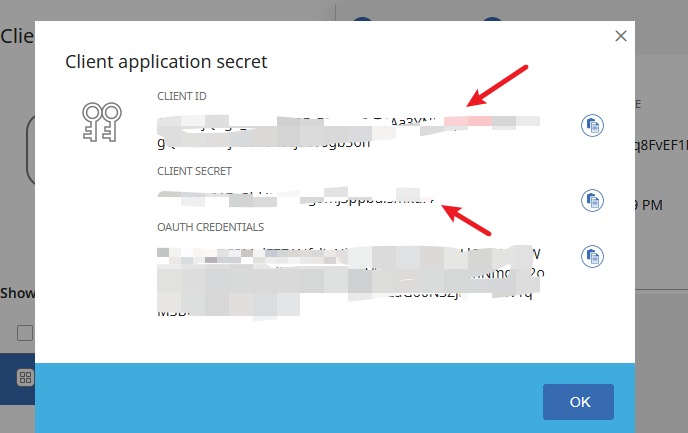
- Add a new application, copy the Client ID and Client Secret.
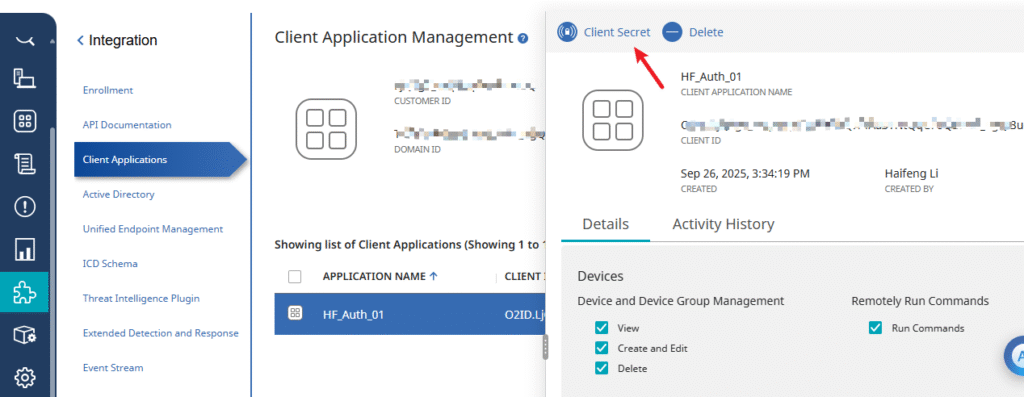
- Under Event Streams, create a stream and note the Stream GUID.
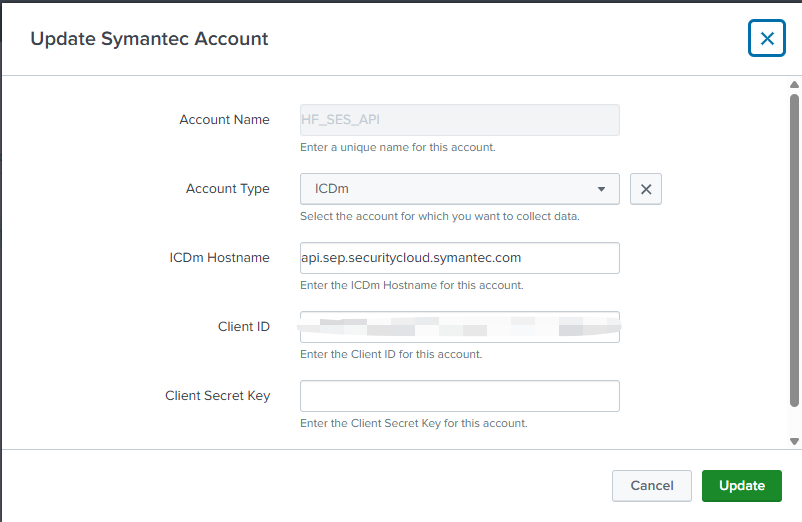
5.2 Add Account in Splunk
In Symantec SOC View Add-on for Splunk:
- Go to Configuration > Symantec Account > Add
- Account Type: ICDm
- Fill in Hostname (ICDm API endpoint), Client ID, and Client Secret
- Save
5.3 Configure Event Stream Input
- Navigate to Inputs > Create New Input > Symantec ICDm Event Stream
- Parameters:
- Index → create/use
symc_events - ICDm Account → select the account above
- Stream GUID → from ICDm console
- Channel Number → start at 0 (create multiple if stream has >1 channel)
- Connection Timeout → default 30 minutes
- Index → create/use
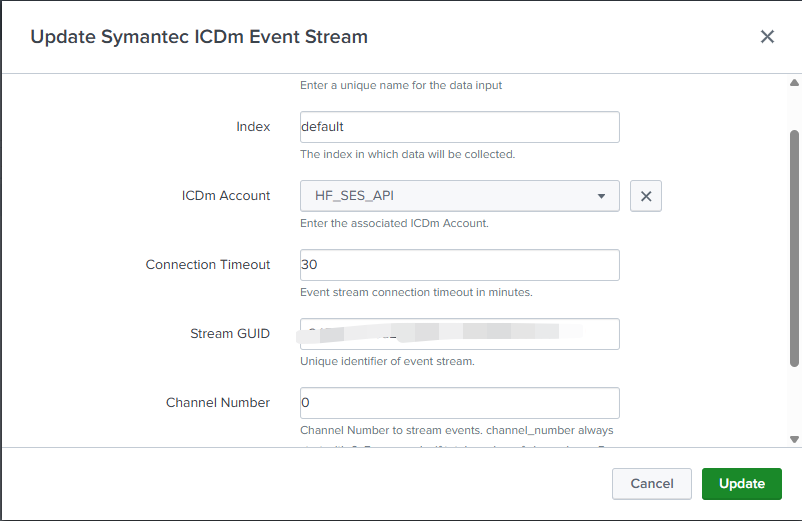
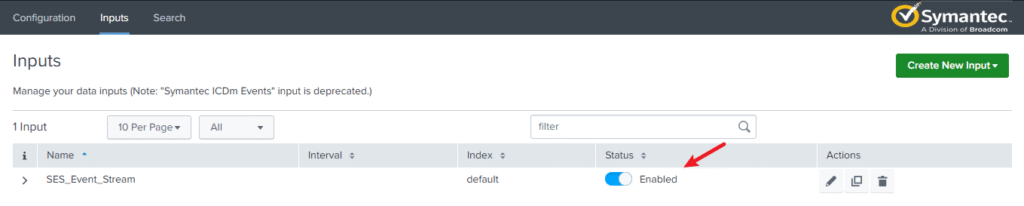
- Enable the input → Splunk will start pulling logs
6. Enable Data Models
Many dashboards in the SOC View App depend on data model acceleration.
- In Splunk Web: Settings > Data Models
- Find Symantec Endpoint
- Enable Acceleration, set summary range
- Save and wait for summaries to build
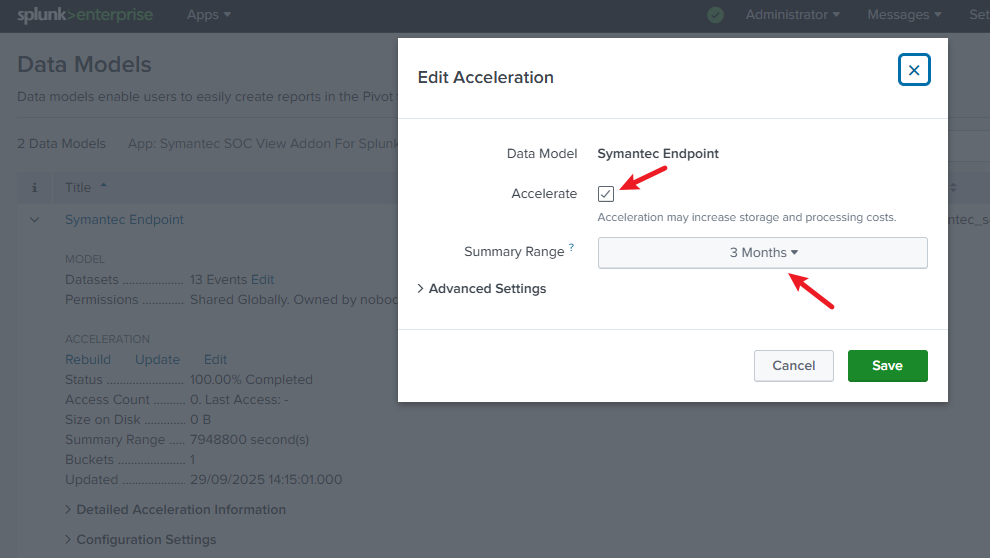
Without this, dashboards may show empty results or run slowly.
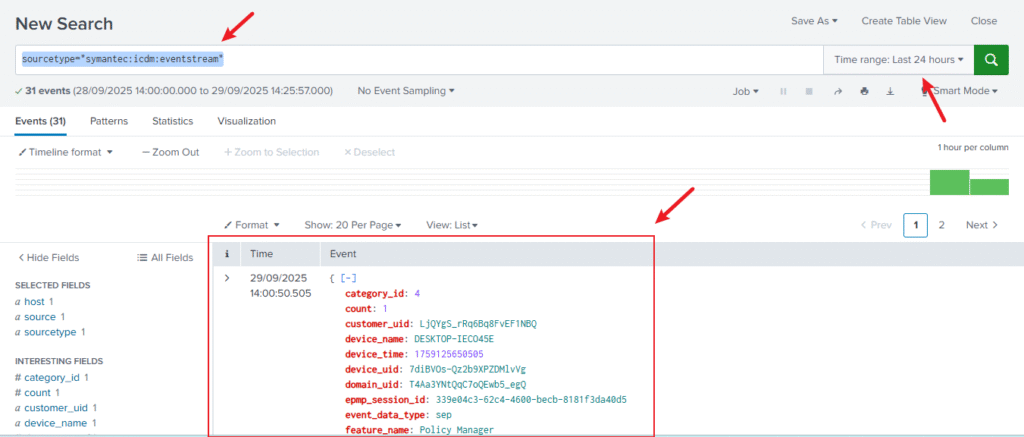
7. Verify Data
Run a simple search:
sourcetype="symantec:icdm:eventstream"
You should see SES logs (events, alerts, policies).
Recent Comments