Monitoring IOS-XE device with Netconf API + Grafana + InfluxDB
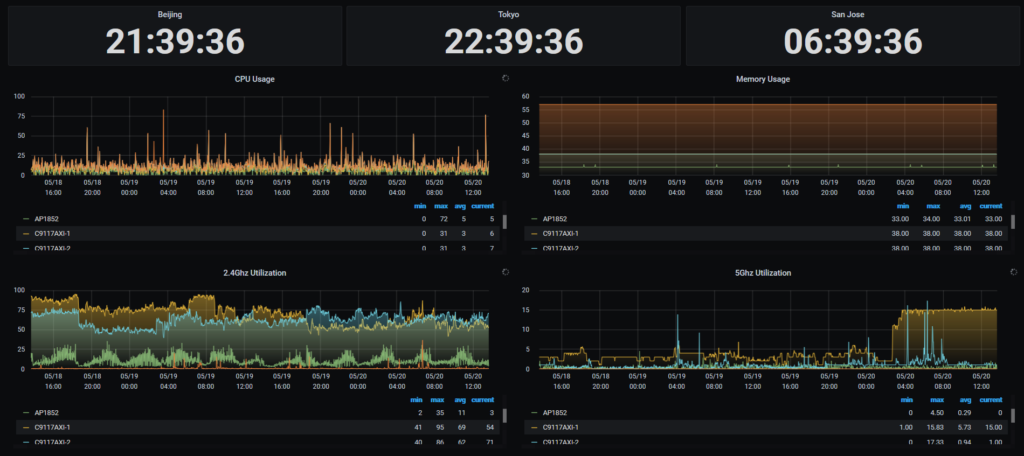
In this article I will discuss how to use Netconf API + Grafana + InfluxDB to monitor IOS-XE devices, such as Cisco Catalyst 9800 Series Wireless Controllers or Cisco Cloud Services Router 1000V Series. The final result is as follows.
The concept of Netconf API has been proposed as early as this century, but it has recently become popular. Compared with other automation solutions (Ansible / Paramiko / SNMP, etc.), it has higher security, wider compatibility, and better scalability. I will try my best to document the process of build the monitoring system in detail.
Topology and process
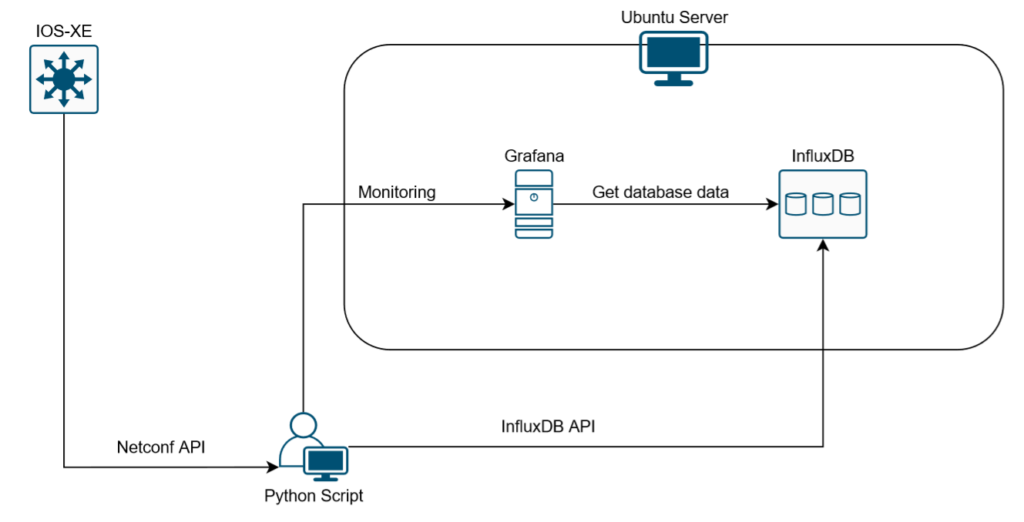
- Use the Netconf API to get information from IOS-XE devices
- Send relevant data to InfluxDB
- Import InfluxDB in Grafana
- Access to the Grafana GUI for monitoring
Prerequisites
The information in this document is based on these software and hardware versions:
- Python 3.7
- Grafana 6.7.3
- InfluxDB 1.6.4
- Yang Explorer 0.8.0 Beta
- IOS-XE 17.01.01 (CSR1000v or C9800 Wireless Controller)
- Ubuntu Server 19.10
Please prepare the above environment in advance, the following articles in my blog may helps you.
Install Yang Explorer on Ubuntu
Upload Yang Models to the Yang-explorer
Install Grafana and InfluxDB on Ubuntu server
Configure network with netplan on Ubuntu
Upgrade a Cisco Catalyst 9800 Series Wireless Controller
Netconf API
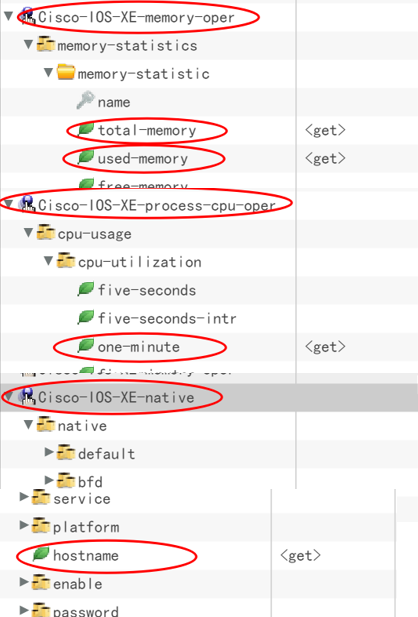
Access Yang Explorer and generate RPC. The following example is to get hostname / cpu usage / total memory / used memory of IOS-XE device.
Then try to get the above information with a Python script. Example is as follows.
from ncclient import manager
import xmltodict

# Setting parameters
host = '10.1.1.1'
user = 'admin'
password = 'Cisco123'

# netconf xml file
payload = """
<filter xmlns="urn:ietf:params:xml:ns:netconf:base:1.0">
  <cpu-usage xmlns="http://cisco.com/ns/yang/Cisco-IOS-XE-process-cpu-oper">
    <cpu-utilization>
      <one-minute/>
    </cpu-utilization>
  </cpu-usage>
  <native xmlns="http://cisco.com/ns/yang/Cisco-IOS-XE-native">
    <hostname/>
  </native>
  <memory-statistics xmlns="http://cisco.com/ns/yang/Cisco-IOS-XE-memory-oper">
    <memory-statistic>
      <total-memory/>
      <used-memory/>
    </memory-statistic>
  </memory-statistics>
</filter>
"""

# Connect to device
with manager.connect(
        host=host, port=830, username=user,
        password=password, device_params={'name': 'csr'},
        hostkey_verify=False) as m:
    # Get information and convert to dict
    netconf_reply = m.get(payload).xml
    netconf_dict = xmltodict.parse(netconf_reply)

# Set hostname, cpu_load, memory_load
cpu_load = netconf_dict['rpc-reply']['data']['cpu-usage']['cpu-utilization']['one-minute']
total_memory = netconf_dict['rpc-reply']['data']['memory-statistics']['memory-statistic'][0]['total-memory']
used_memory = netconf_dict['rpc-reply']['data']['memory-statistics']['memory-statistic'][0]['used-memory']
memory_load = int (int(used_memory) / int(total_memory) * 100)
hostname = netconf_dict['rpc-reply']['data']['native']['hostname']

print(hostname)
print(cpu_load)
print(memory_load)
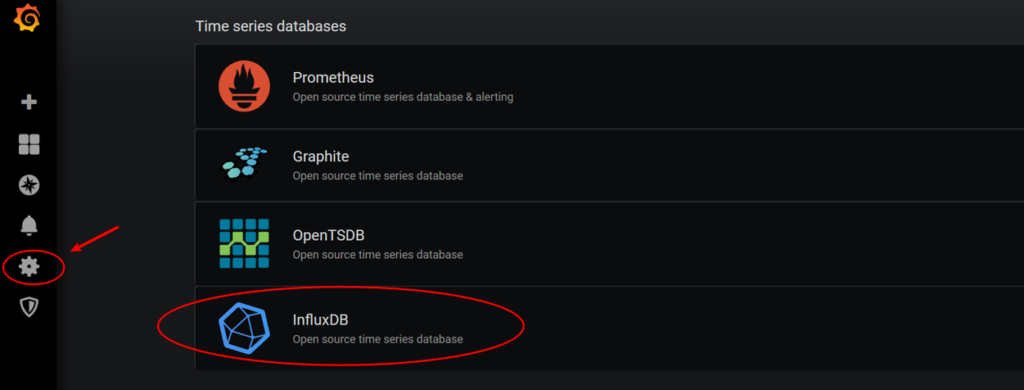
InfluxDB Configuration
InfluxDB is an open source time series database, which is very suitable for monitoring scenarios. Let’s create a database named “test”.
> influx
> show databases
> create database test
Try to write InfluxDB with Python script, the example is as follows.
from influxdb import InfluxDBClient
from datetime import datetime

# Connect to InfluxDB
client = InfluxDBClient('10.1.1.2', 8086, 'root', 'root', 'test')

# Get and format the current time
current_time = datetime.utcnow().strftime('%Y-%m-%dT%H:%M:%SZ')

# Format data as json
w_json = [{
    "measurement": 'usage',
    "time": current_time,
    "tags": {
        'hostname': "test"
    },
    "fields": {
        'cpu_load': 27,
        'memory_load': 39
    }
}]

# Write to InfluxDB
client.write_points(w_json)
After running the script, check whether it is written normally.
>select * from usage
>select "hostname","cpu_load","memory_load" from usage
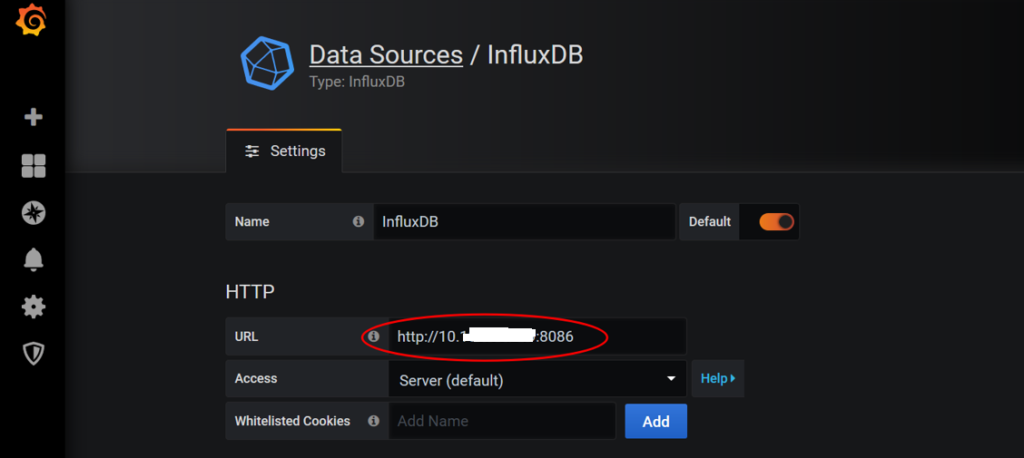
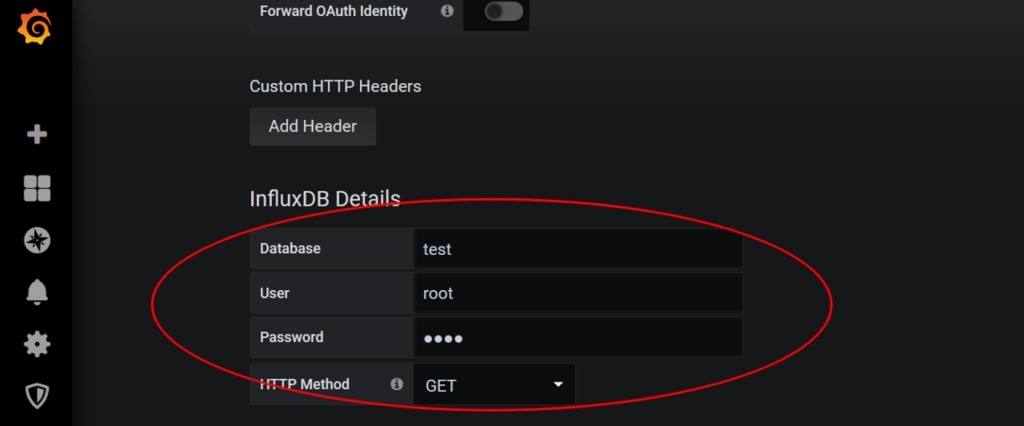
Grafana Configuration
We need to add InfluxDB to the data source.
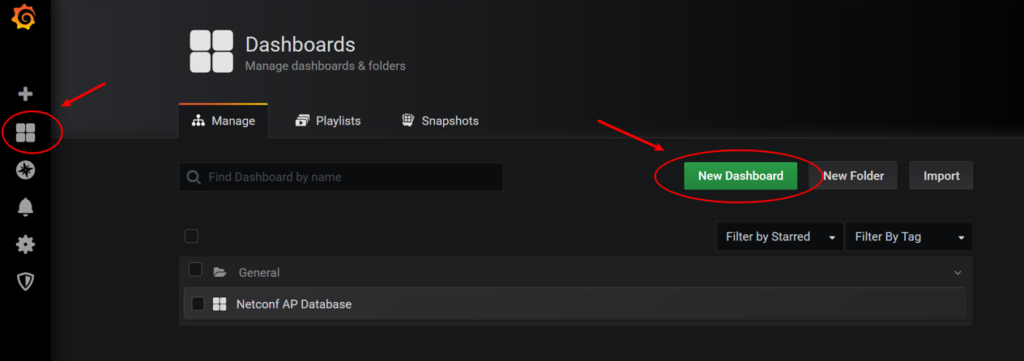
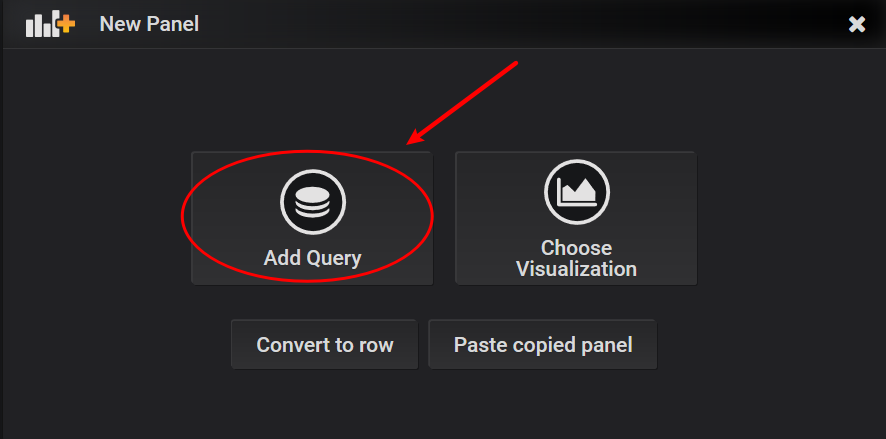
Then save & test to see if it works. After that we need to add Dashboard & Panel.
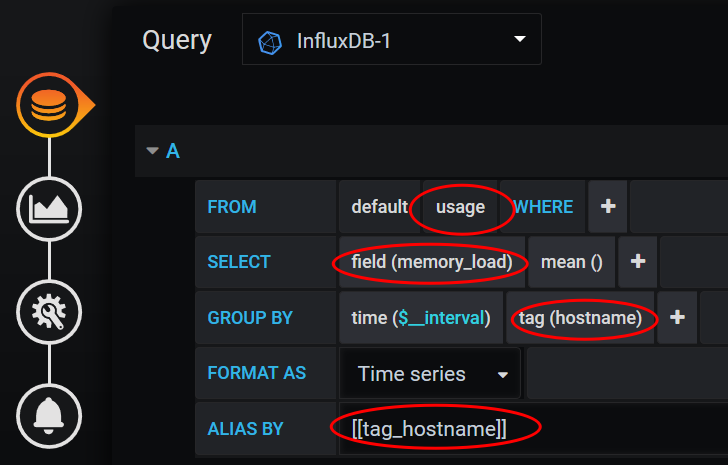
Configure tag, field, etc.
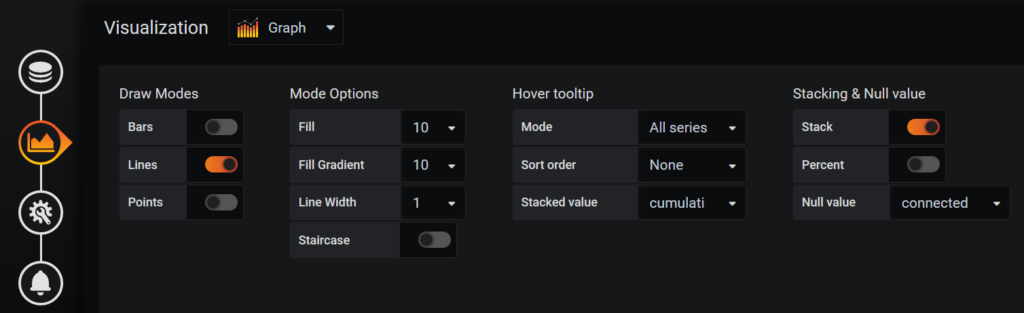
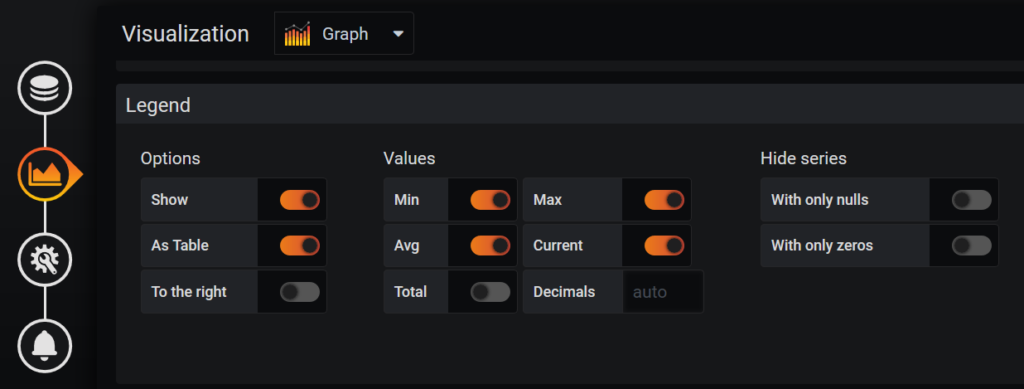
Design the chart style you like, The following is my configuration, for reference only.
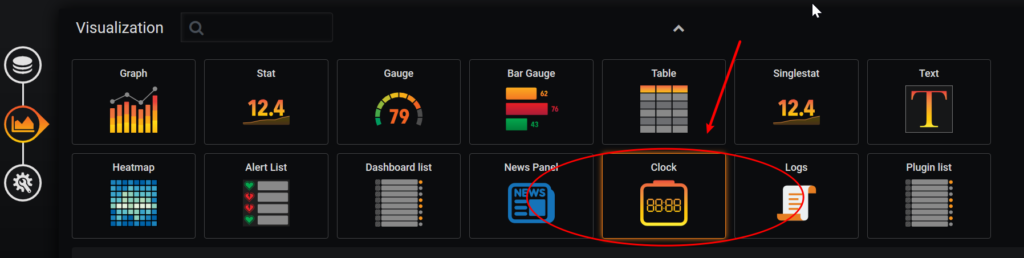
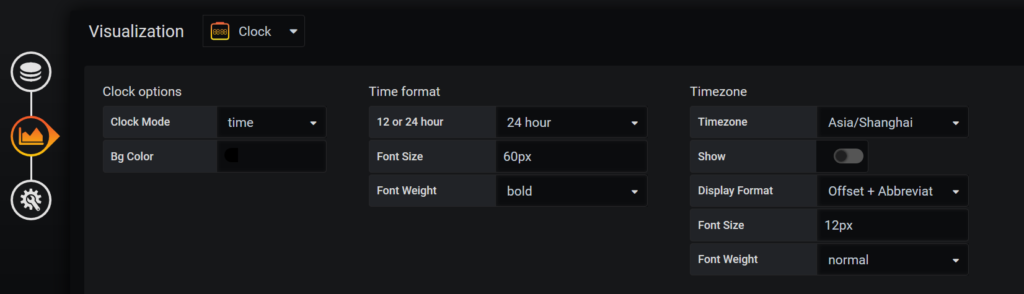
Now we need to install and add Clock plugin.
grafana-cli plugins install grafana-clock-panel
sudo service grafana-server restart
Python Script
All that is left now is to combine the above Netconf Python script and InfluxDB Python script. I will share my examples.
Example 1: Monitor CPU load and Memory load of IOS-XE device
Example 2: Monitor CPU load / Memory load and 2.4Ghz / 5Ghz utilization of AP (managed by the C9800 wireless controller)
Example 1:
from ncclient import manager
import xmltodict
from influxdb import InfluxDBClient
from datetime import datetime
import time

# Connect to InfluxDB
client = InfluxDBClient('10.1.1.2', 8086, 'root', 'root', 'test')

# Setting parameters
host = '10.1.1.1'
user = 'admin'
password = 'Cisco123'

# netconf xml file
payload = """
<filter xmlns="urn:ietf:params:xml:ns:netconf:base:1.0">
  <cpu-usage xmlns="http://cisco.com/ns/yang/Cisco-IOS-XE-process-cpu-oper">
    <cpu-utilization>
      <one-minute/>
    </cpu-utilization>
  </cpu-usage>
  <native xmlns="http://cisco.com/ns/yang/Cisco-IOS-XE-native">
    <hostname/>
  </native>
  <memory-statistics xmlns="http://cisco.com/ns/yang/Cisco-IOS-XE-memory-oper">
    <memory-statistic>
      <total-memory/>
      <used-memory/>
    </memory-statistic>
  </memory-statistics>
</filter>
"""


while True:

    # Connect to device
    with manager.connect(
            host=host, port=830, username=user,
            password=password, device_params={'name': 'csr'},
            hostkey_verify=False) as m:
        # Get information and convert to dict
        netconf_reply = m.get(payload).xml
        netconf_dict = xmltodict.parse(netconf_reply)

    # Set hostname, cpu_load, memory_load
    cpu_load = netconf_dict['rpc-reply']['data']['cpu-usage']['cpu-utilization']['one-minute']
    total_memory = netconf_dict['rpc-reply']['data']['memory-statistics']['memory-statistic'][0]['total-memory']
    used_memory = netconf_dict['rpc-reply']['data']['memory-statistics']['memory-statistic'][0]['used-memory']
    memory_load = int (int(used_memory) / int(total_memory) * 100)
    hostname = netconf_dict['rpc-reply']['data']['native']['hostname']

    # Get and format the current time
    current_time = datetime.utcnow().strftime('%Y-%m-%dT%H:%M:%SZ')

    # Format data as json
    w_json = [{
        "measurement": 'usage',
        "time": current_time,
        "tags": {
            'hostname': hostname
        },
        "fields": {
            'cpu_load': int(cpu_load),
            'memory_load': int(memory_load)
        }
    }]

    # Write to InfluxDB
    client.write_points(w_json)

    # sleep 5 seconds
    time.sleep(5)
Example 2:
from ncclient import manager
import xmltodict
from influxdb import InfluxDBClient
from datetime import datetime
import time

# Setting parameters
host = '10.1.1.1'
user = 'admin'
password = 'Cisco123'

# netconf xml file
payload = """
<filter xmlns="urn:ietf:params:xml:ns:netconf:base:1.0">
  <access-point-oper-data xmlns="http://cisco.com/ns/yang/Cisco-IOS-XE-wireless-access-point-oper">
    <ap-name-mac-map>
      <wtp-name/>
    </ap-name-mac-map>
    <oper-data>
      <ap-sys-stats>
        <cpu-usage/>
        <memory-usage/>
      </ap-sys-stats>
    </oper-data>
  </access-point-oper-data>
  <mcast-oper-data xmlns="http://cisco.com/ns/yang/Cisco-IOS-XE-wireless-mcast-oper">
    <rrc-history-client-record-data>
      <curr-channel-util/>
    </rrc-history-client-record-data>
  </mcast-oper-data>
  <rrm-oper-data xmlns="http://cisco.com/ns/yang/Cisco-IOS-XE-wireless-rrm-oper">
    <rrm-measurement>
      <load>
        <cca-util-percentage/>
      </load>
    </rrm-measurement>
  </rrm-oper-data>
</filter>
"""

# Connect to InfluxDB
client = InfluxDBClient('10.1.1.2', 8086, 'root', 'root', 'test1')

while True:

    # Connect to device
    with manager.connect(
            host=host, port=830, username=user,
            password=password, device_params={'name': 'iosxr'},
            hostkey_verify=False) as m:

        # Get information and convert to dict
        netconf_reply = m.get(payload).xml
        netconf_dict = xmltodict.parse(netconf_reply)

        # Channel information related count
        channel_count = 0

        try:

            for i in range(
                    0, len(
                    netconf_dict['rpc-reply']['data']['access-point-oper-data']['ap-name-mac-map'])):

                # Get CPU / Memory usage
                wtp_name = netconf_dict['rpc-reply']['data']['access-point-oper-data']['ap-name-mac-map'][i]['wtp-name']
                cpu_usage = int(netconf_dict['rpc-reply']['data']['access-point-oper-data']
                                ['oper-data'][i]['ap-sys-stats']['cpu-usage'])
                memory_usage = int(
                    netconf_dict['rpc-reply']['data']['access-point-oper-data']['oper-data'][i]['ap-sys-stats']['memory-usage'])

                # Get channel utilization
                channel_24ghz = int(netconf_dict['rpc-reply']['data']['rrm-oper-data'][
                                    'rrm-measurement'][channel_count]['load']['cca-util-percentage'])
                channel_count = channel_count + 1

                channel_5ghz = int(netconf_dict['rpc-reply']['data']['rrm-oper-data'][
                                   'rrm-measurement'][channel_count]['load']['cca-util-percentage'])
                channel_count = channel_count + 1

                # Get and format the current time
                current_time = datetime.utcnow().strftime('%Y-%m-%dT%H:%M:%SZ')

                # Format data as json
                w_json = [{
                    "measurement": 'test1',
                    "time": current_time,
                    "tags": {
                        'AP Name': wtp_name
                    },
                    "fields": {
                        'CPU Usage': cpu_usage,
                        'Memory Usage': memory_usage,
                        '2.4Ghz Utilization': channel_24ghz,
                        '5Ghz Utilization': channel_5ghz
                    }
                }]

                # Write to InfluxDB
                client.write_points(w_json)

                time.sleep(5)

        # Prevent KeyError
        except BaseException:

            time.sleep(120)
            pass
Run the script in Ubuntu
Maybe you need to run the script for a long time, so uploading the script to the Ubuntu server and running it is a good choice.
scp -r grafana.py username@10.1.1.1:/tmp
Let the script run in the background of the server, even exiting ssh session will not affect its operation.
nohup python3 grafana.py &
Other
Thank you very much for your patience. If you have any suggestions for the content of this article, please feel free to leave me a message.
References
ncclient
InfluxDB-Python
Install InfluxDB OSS
CiscoDevNet/yang-explorer
Get started with InfluxDB OSS
Grafana – Install on Debian or Ubuntu
I can only thank you, until yesterday I did not know how to make my python script to monitor my CSR1000v 16.12.3 router, now I am trying to get “in-octets, out-octets” but InfluxDB no data, values are zero (0).
My payload:
My set:
in_octets = netconf_dict[‘rpc-reply’][‘data’][‘interfaces’][‘interface’][0][‘statistics’][‘in-octets’]
out_octets = netconf_dict[‘rpc-reply’][‘data’][‘interfaces’][‘interface’][0][‘statistics’][‘out-octets’]
Maybe you can help me, I would appreciate it very much.
PS: excuse my english, it’s not very good.
Thank you very much for contacting me by email. I checked your code and I modified it a bit.
—————————-
interface_length = len(netconf_dict[‘rpc-reply’][‘data’][‘interfaces’][‘interface’])
for i in range(0, interface_length):
name = netconf_dict[‘rpc-reply’][‘data’][‘interfaces’][‘interface’][i][‘name’]
speed = netconf_dict[‘rpc-reply’][‘data’][‘interfaces’][‘interface’][i][‘speed’]
in_octets = netconf_dict[‘rpc-reply’][‘data’][‘interfaces’][‘interface’][i][‘statistics’][‘in-octets’]
out_octets = netconf_dict[‘rpc-reply’][‘data’][‘interfaces’][‘interface’][i][‘statistics’][‘out-octets’]
calculo_bandwidth = int ((int(in_octets) + int(out_octets) * 8 * 100)) / ((1000) * int(speed))
bandwidth = int (calculo_bandwidth * 0.000008)
print(‘The ‘+ str(i) +’ th interface information.\n’,
“Interface: ” + name + ‘\n’,
“Speed: ” + speed + ‘\n’,
“In Octets: ” + str(in_octets) + ‘\n’,
“Out Octets: ” + str(out_octets) + ‘\n’,
“Calculo Bandwidth: ” + str(calculo_bandwidth) + ‘\n’,
“Bandwidth: ” + str(bandwidth) + ‘\n’,
)
print(“-“*20 + ‘\n’)
—————————-